1 Introduction
This tutorial will be the first of many blog posts for new researchers and science program students/trainees on how to use R as an analytical and productivity tool in the process of conducting scientific research. Specifically, in this post I will explain why you might want to use R and provide a brief overview of the basic R workflow used in the analysis of experimentally obtained data.
As someone who has spent many years analyzing data using a variety of technologies (e.g. SPSS, Excel, R), I know how intimidating and frustrating it can be to start learning R for the first time instead of using the simple point-and-click graphical user interfaces (GUIs) provided by commercial (i.e. paid) programs like SPSS. These programs work fine for implementing many simple and common analytical methods (e.g. t-tests, one-way ANOVAs to compare 2+ groups to one another on a single dependent measure) but as your research questions and data structures become more complicated (e.g. predictive modelling, working with non-normally distributed data), you will quickly find the functionality of these GUI-based programs to be rather limited. For me, this realization occured as a new graduate student at McMaster when I wanted to test a complex experimental hypothesis to see if there was a difference between one experimental group and several other groups (simultaneously, thereby avoiding the need to correct p-values for multiple comparisons) using a linear contrast within a factorial ANOVA (the subject of a future blog post). You also have to pay to use commercial statistical packages, which can be a significant barrier for low-income students or even reseach labs struggling to maintain operating funds (which is most labs in Canada given the ~15% current funding rate).
In contrast, R is constantly undergoing development by a large community of statisticians, scientific researchers, and other data science professionals, offering a way to use pretty much any analytical tool out there. Moreover, as long as researchers and statisticians continue preferring to develop novel analytical methods in R, it will continue to be the most advanced statistical software available. However, the fact that so many people are developing R also means that for any given analytical method of interest there will be multiple different ways of using it in R, each potentially requiring very different syntax. Thus, knowing which of the many options to use can be a huge challenge for new useRs. As someone with experience training researchers to use R, and who has spent countless hours exploring the many options available to do different things in R, a major purpose of this blog will be to demonstrate how to use R for data analysis and boost your research productivity using methods that I have found to work best (from a scientific research perspective) in practice.
Once you know what you are doing (e.g. from reading these posts), R can arguably be even easier to use than commercial programs. This is clearly demonstrated by the fact that one can accomplish a great deal with only a few lines of code, e.g. a simple linear regression requires only a single line of code (to be covered in more detail in a future post):
summary(lm(Y ~ X, data = your_dataset)) With this line you ask R for a (regression) summary of a linear model (lm) where Y is a continuous outcome variable, X is a predictor, X and Y are contained in the dataframe “your_dataset”, and “~” means “as a function of”. You would have to click through seveal menus to obtain the same results in a GUI-based program.
Perhaps the greatest benefit of using R is that once you have written a script to conduct an analysis, you can reproduce that analysis with new data simply by re-running the script (updating variable names as needed). When combined with R Markdown, you can generate reproducible reports which make collaboration and communication of your results much easier. Think of just re-running a script a collaborator has written in R vs. following a set of step-by-step instructions to reproduce an analysis done via SPSS or Excel. The former usually takes less than a minute, while the latter could take hours and depends on how good your colleague’s instructions are. Since R is a fully functional programming language, things get even better when you start automating repetitive processess using loops.
Another major advantage of using R is of course that it is free.
2 Workflow Outline
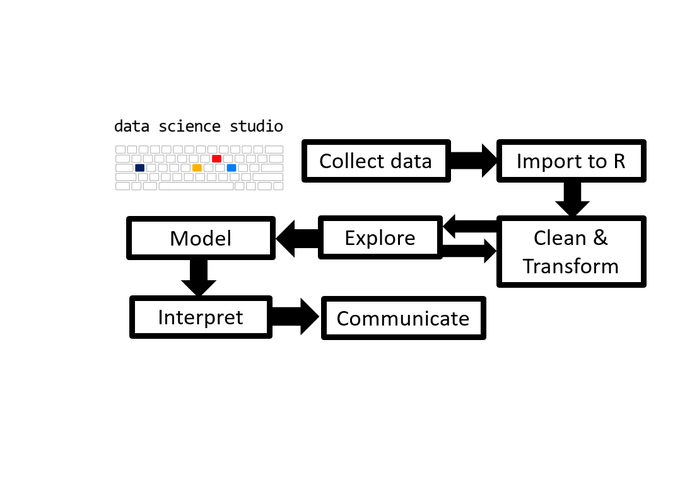
Now that we know why you should use R, what are the main steps of analyzing data? My typical analytical workflow follows these 7 steps:
- 0.Install and load necessary packages (e.g. tidyverse)
- 1. Import data.
- 2. Clean/Transform data. This part usually takes longer than the analysis, but may not be necessary if you’ve entered the data yourself.
- 3. Explore data using descriptive summary statistics and visualisations.
- 4. Resolve structural issues. If any issues are detected in step 3, go back to step 2 and resolve them, restructuring data as needed.
- 5. Model: Fit an appropriate statistical model & check model assumptions (e.g. normality). Use a different model/test if assumptions are violated (e.g. a permutation test). Conduct follow-up or post-hoc tests if desired.
- 6. Analyze and Interpret the results using appropriate graphics (e.g. tables/figures) and text summaries. These can easily be used as a foundation for building presentation slides or the results section of a manuscript.
- 7. Communicate the results to the target audience (e.g. other scientists) with a description of the methods used, relevant background/introduction and insightful discussion in a coherent and accessible report.
This represents the basic steps involved in the majority of data analysis tasks that one typically encounters in the social and behavioural sciences. As you might expect, for machine learning projects there are a few extra steps involved.
Each of these sections will be covered in detail in future posts. Thanks for reading and I welcome any suggestions for future posts, comments or other feedback you might have.
2.2 Notes
- This post has been peer-reviewed and approved by the University of Victoria Data Science Studio
- The workflow I recommend above is very similar to the well-known data science workflow advocated by Grolemund and Wickham in their R for data science book. However, an important difference is that I recommend that most/all of the exploration and wrangling of the data be completed prior to advancing to the modelling stage. The idea is to sort out the structure of your final analytical dataset first and fit fewer models to save time.
Thank you for reading and I welcome any suggestions for future posts, comments or other feedback you might have. Feedback from beginners and science students/trainees (or with them in mind) is especially helpful in the interest of making this guide even better for them.
This blog is something I do as a volunteer in my free time. If you’ve found it helpful and want to give back, coffee donations would be appreciated.